Vehicle Sales Analysis
An in-depth analysis of global Electric Vehicle (EV) trends, sales data, and powertrain distribution from 2010 to 2024.
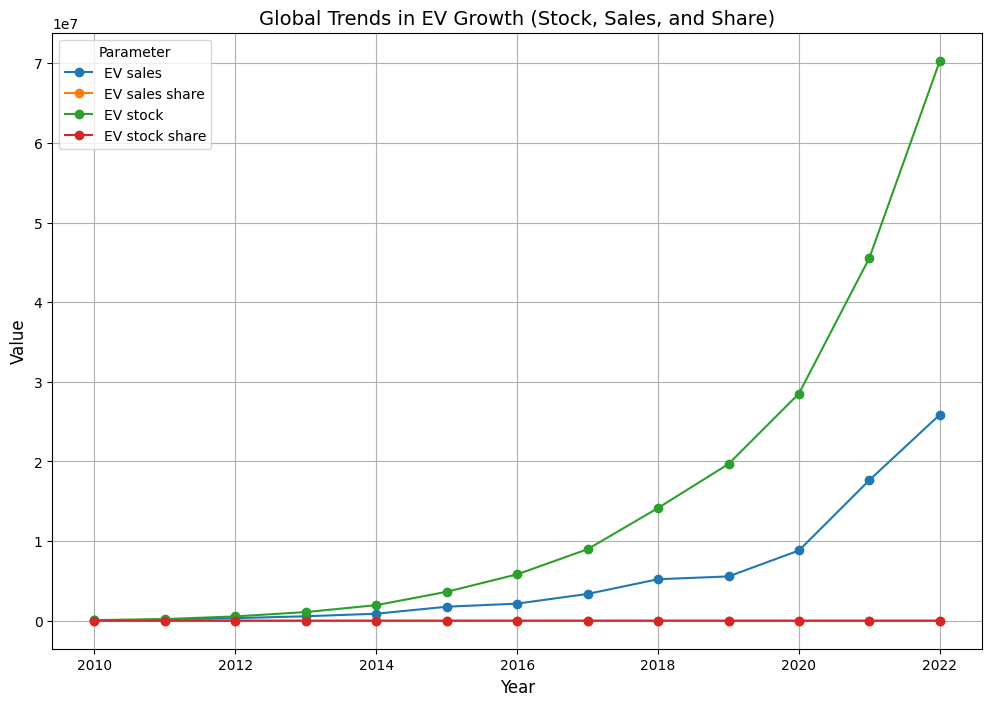
Global EV Growth
The chart illustrates the exponential growth of Electric Vehicle stock, sales, and market share over the years, highlighting the accelerating shift towards sustainable transport.
View Python Code
import pandas as pd
import matplotlib.pyplot as plt

key_parameters = ['EV stock', 'EV sales', 'EV sales share', 'EV stock share']
filtered_historical = historical_data[historical_data['parameter'].isin(key_parameters)]
global_trends = filtered_historical.groupby(['year', 'parameter'])['value'].sum().reset_index()
global_trends_pivot = global_trends.pivot(index='year', columns='parameter', values='value')

plt.figure(figsize=(10, 6))
global_trends_pivot.plot(ax=plt.gca(), marker='o')
plt.title("Global Trends in EV Growth", fontsize=14)
plt.xlabel("Year", fontsize=12)
plt.ylabel("Value", fontsize=12)
plt.legend(title="Parameter")
plt.grid()
plt.show()
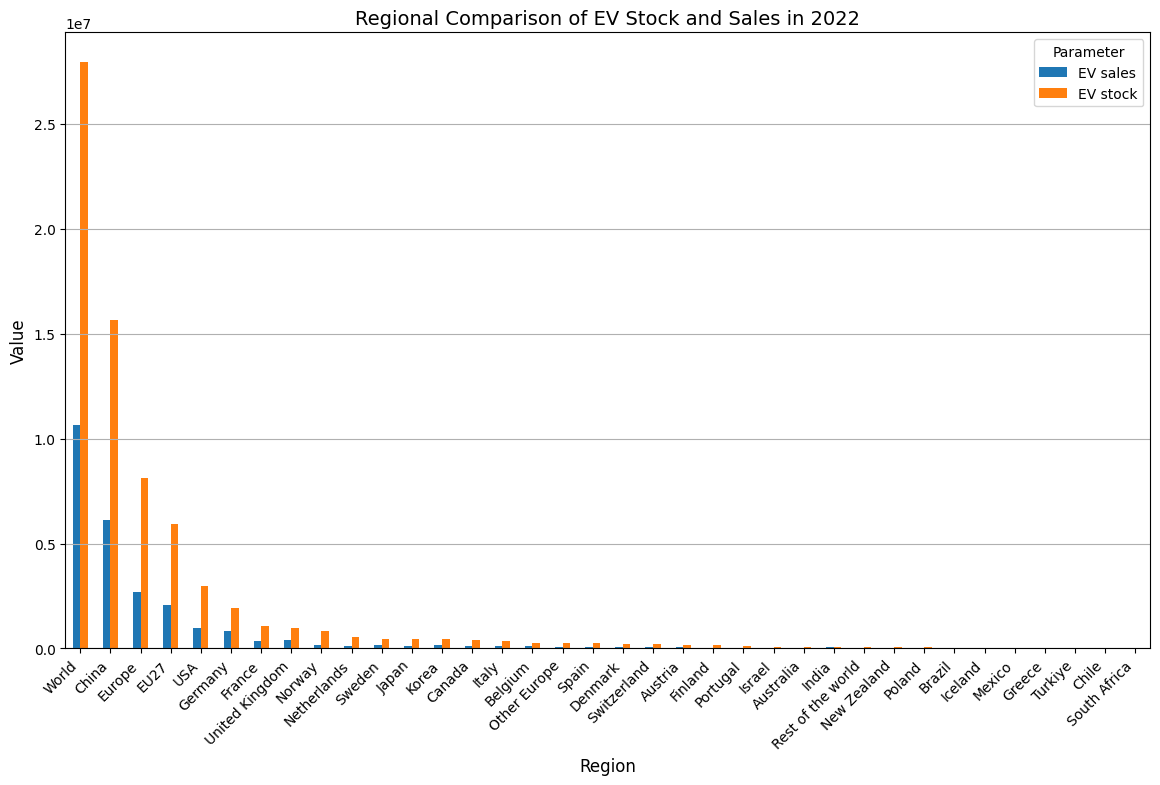
Regional Comparison
Comparing EV stock vs sales across major regions. This visualization identifies key markets driving the global adoption of electric vehicles.
View Python Code
regional_trends = filtered_historical[filtered_historical['parameter'].isin(['EV stock', 'EV sales'])]
latest_year = regional_trends['year'].max()
regional_summary = regional_trends[regional_trends['year'] == latest_year].groupby(['region', 'parameter'])['value'].sum().reset_index()

regional_summary_pivot = regional_summary.pivot(index='region', columns='parameter', values='value')
regional_summary_pivot.sort_values(by='EV stock', ascending=False).plot(kind='bar', figsize=(10, 6))

plt.title(f"Regional Comparison of EV Stock and Sales in {latest_year}")
plt.xlabel("Region")
plt.ylabel("Value")
plt.legend(title="Parameter")
plt.grid(axis='y')
plt.xticks(rotation=45, ha='right')
plt.show()
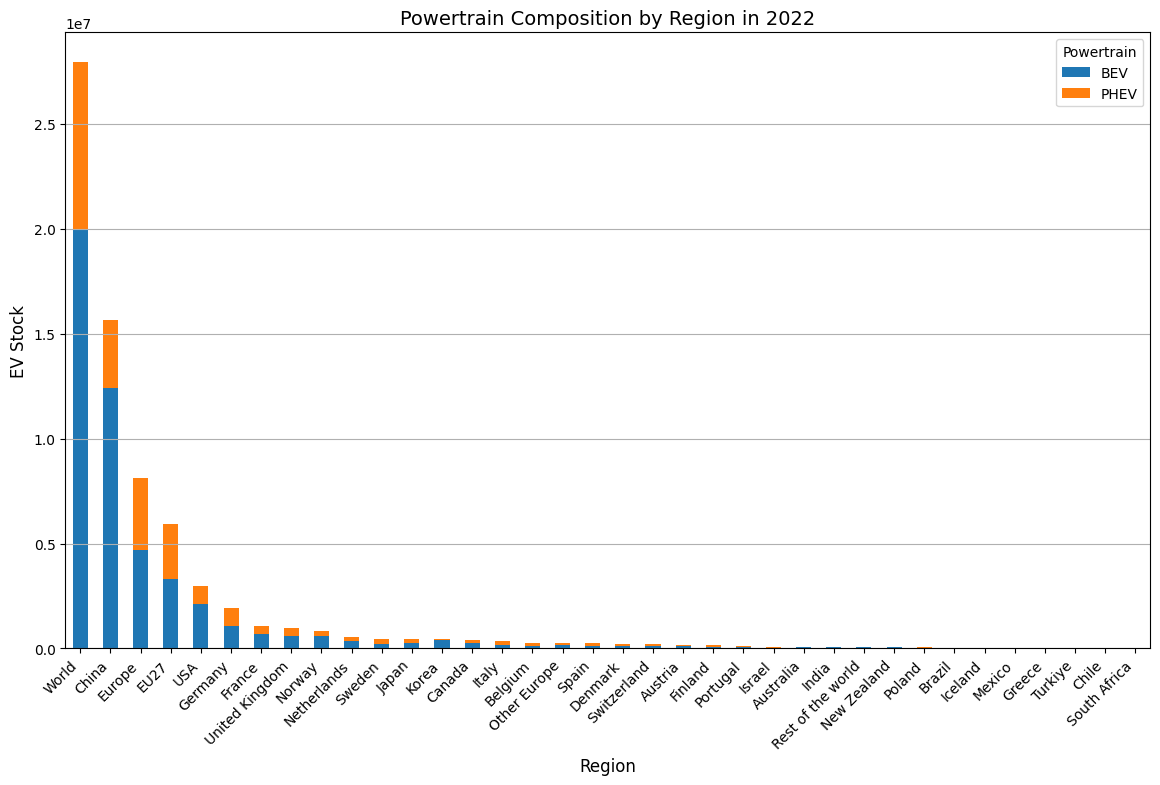
Powertrain Analysis
Breakdown of powertrain types (BEV vs PHEV) by region. This helps understand the technological preference in different markets.
View Python Code
powertrain_data = historical_data[(historical_data['year'] == latest_year) & (historical_data['parameter'] == 'EV stock')]
powertrain_summary = powertrain_data.groupby(['region', 'powertrain'])['value'].sum().reset_index()

powertrain_summary_pivot = powertrain_summary.pivot(index='region', columns='powertrain', values='value').fillna(0)
powertrain_summary_pivot['Total'] = powertrain_summary_pivot.sum(axis=1)
powertrain_summary_pivot.sort_values(by='Total', ascending=False).drop(columns=['Total']).plot(kind='bar', stacked=True, figsize=(10, 6))

plt.title(f"Powertrain Composition by Region in {latest_year}")
plt.xlabel("Region")
plt.ylabel("EV Stock")
plt.legend(title="Powertrain")
plt.grid(axis='y')
plt.xticks(rotation=45, ha='right')
plt.show()
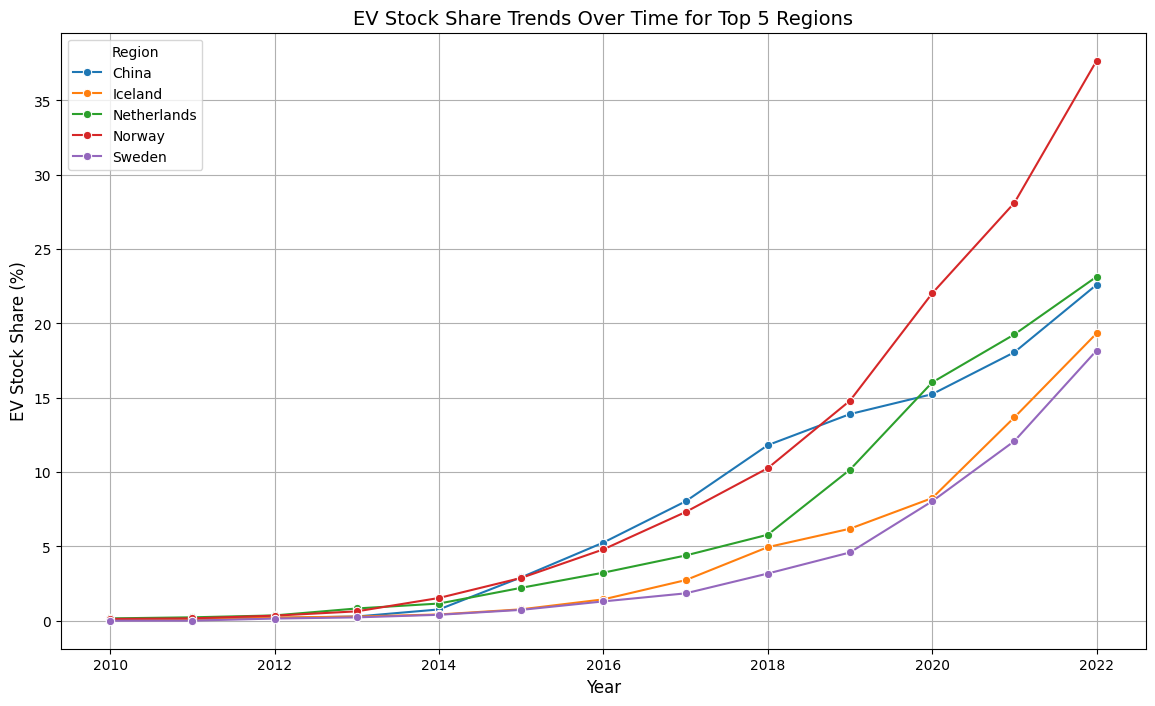
Stock Share Trends
Historical trends for the top 5 leading regions. This line chart visualizes the adoption rate over the last decade.
View Python Code
stock_share_data = historical_data[historical_data['parameter'] == 'EV stock share']
stock_share_trends = stock_share_data.groupby(['region', 'year'])['value'].sum().reset_index()

top_regions = stock_share_trends.groupby('region')['value'].mean().sort_values(ascending=False).head(5).index
top_regions_data = stock_share_trends[stock_share_trends['region'].isin(top_regions)]

plt.figure(figsize=(10, 6))
sns.lineplot(data=top_regions_data, x='year', y='value', hue='region', marker='o')
plt.title("EV Stock Share Trends Over Time", fontsize=14)
plt.xlabel("Year", fontsize=12)
plt.ylabel("EV Stock Share (%)", fontsize=12)
plt.legend(title="Region")
plt.grid()
plt.show()
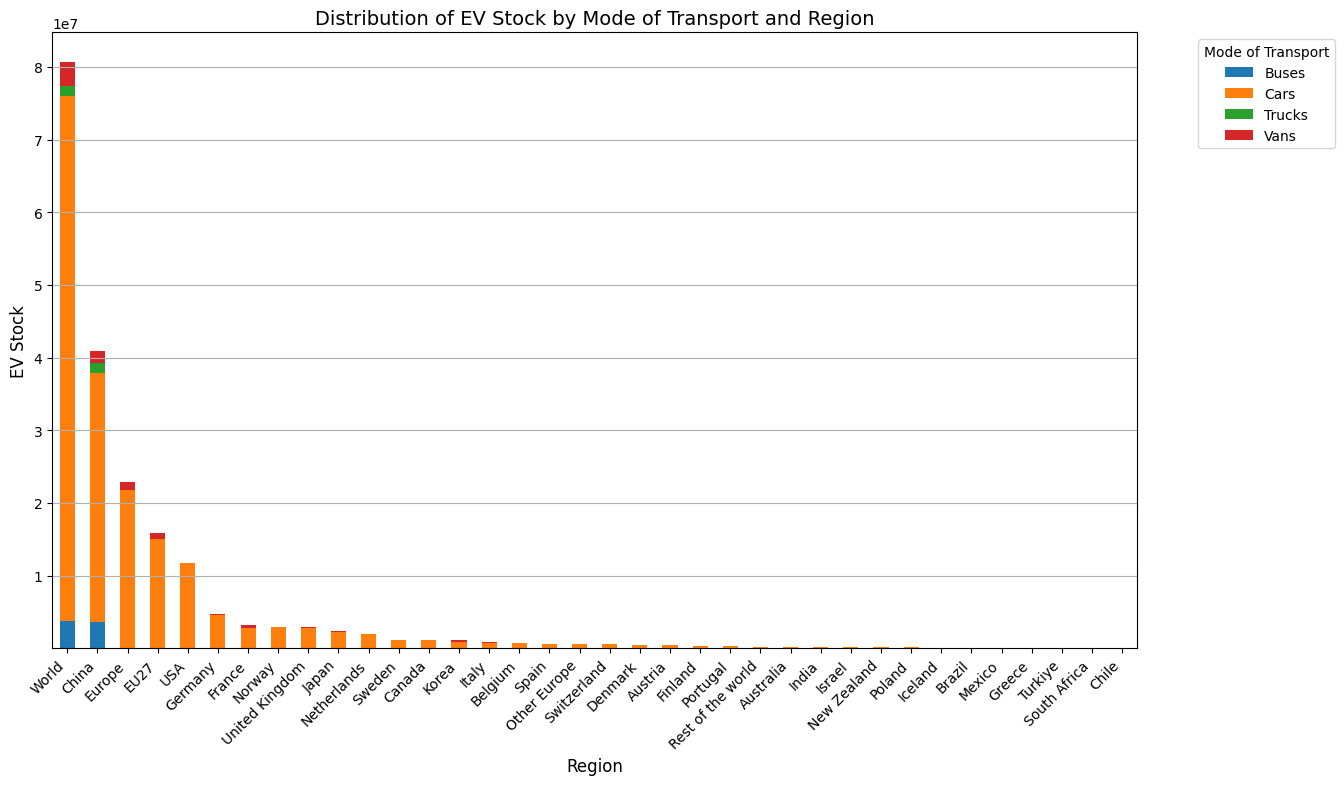
Transport Modes
Distribution of EV stock by mode (Cars, Buses, Trucks, Vans). Cars dominate the market, but other segments are growing.
View Python Code
transport_mode_data = historical_data[historical_data['parameter'] == 'EV stock']
transport_mode_summary = transport_mode_data.groupby(['region', 'mode'])['value'].sum().reset_index()

transport_mode_pivot = transport_mode_summary.pivot(index='region', columns='mode', values='value').fillna(0)
transport_mode_pivot['Total'] = transport_mode_pivot.sum(axis=1)
transport_mode_pivot = transport_mode_pivot.sort_values(by='Total', ascending=False).drop(columns=['Total'])

transport_mode_pivot.plot(kind='bar', stacked=True, figsize=(10, 6))
plt.title("EV Stock by Transport Mode", fontsize=14)
plt.xlabel("Region", fontsize=12)
plt.ylabel("EV Stock", fontsize=12)
plt.legend(title="Mode", bbox_to_anchor=(1.05, 1), loc='upper left')
plt.grid(axis='y')
plt.xticks(rotation=45, ha='right')
plt.show()
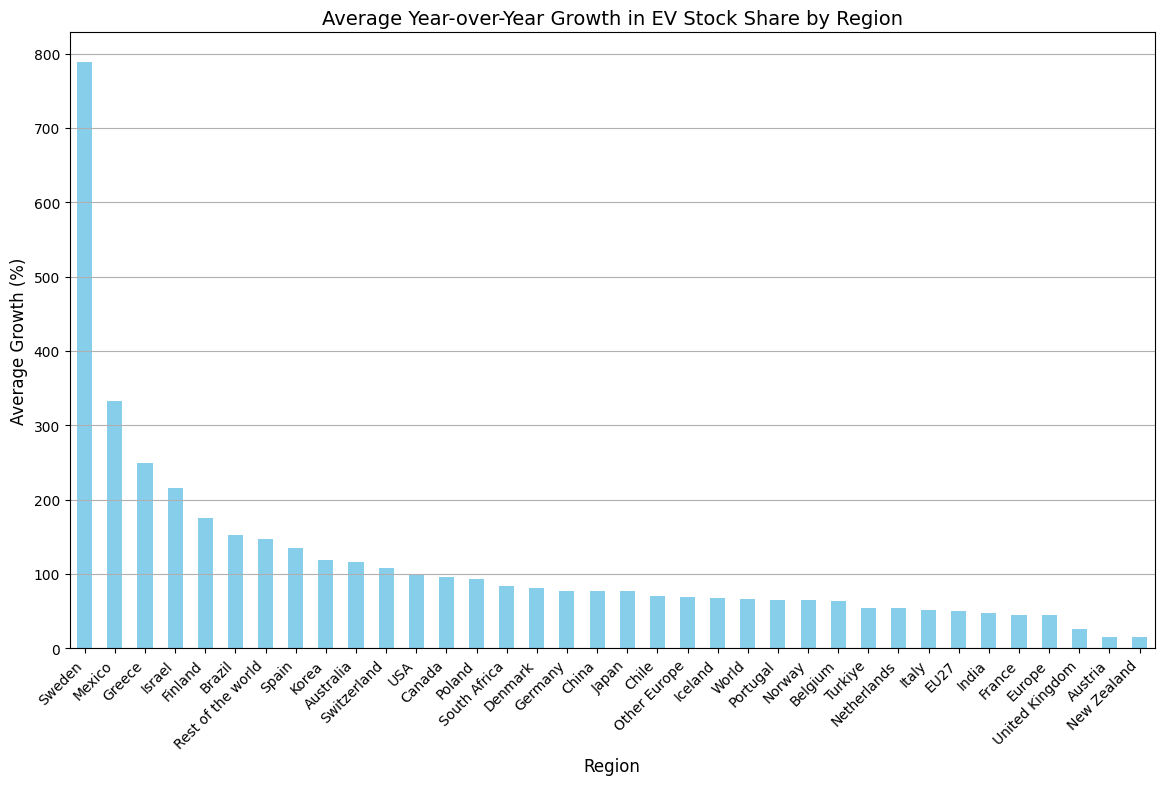
Year-over-Year Growth
Highlighting regions with the fastest expansion rates in EV stock share. This metric is crucial for identifying emerging markets.
View Python Code
policy_effectiveness = stock_share_data.groupby(['region', 'year'])['value'].sum().reset_index()
policy_effectiveness['stock_share_growth'] = policy_effectiveness.groupby('region')['value'].pct_change() * 100
average_growth_by_region = policy_effectiveness.groupby('region')['stock_share_growth'].mean().sort_values(ascending=False)

average_growth_by_region.plot(kind='bar', figsize=(10, 6), color='skyblue')
plt.title("Year-over-Year Growth in EV Stock Share", fontsize=14)
plt.xlabel("Region", fontsize=12)
plt.ylabel("Growth (%)", fontsize=12)
plt.grid(axis='y')
plt.xticks(rotation=45, ha='right')
plt.show()